
case study*
Growing With Style – from $6k/mo
When this client first approached us, they were already a successful off-Amazon brand selling across North America and they had been dipping their toe in Amazon for about 6 months. Although they were getting some sales, it became clear that the quality of their listings and zero PPC was really holding them back.
We started with a deep analysis of their products, keyword research and rewriting their content to help with both search and conversion. Then, we created new product photos and graphics to further enhance their listings – this was essential to communicate the premium value of their products.
Once the listings were optimized, we implemented a bold, multi-faceted PPC strategy to boost sales, get reviews and increase rank. From zero PPC spend to now managing over $30k/mo in ad spend, there were key metrics that we tracked to make sure sales and profitability were moving in the right direction.
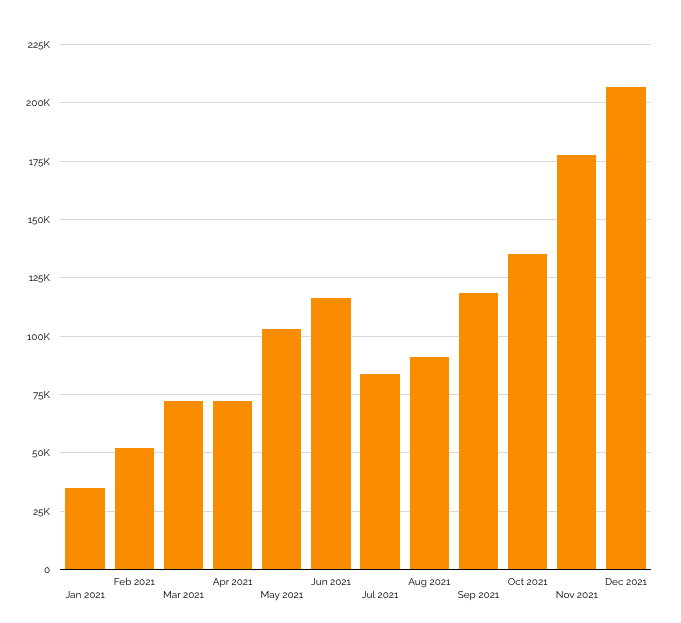
Sales Growth for 2021
Complete Listing Optimization
- Monthly sales volume from $6k/mo to $207k/mo in 18 months
- High converting photography and graphics
- Reached top 10 ranking status (BSR) even though competitors are selling for 50% less
- Cascading PPC strategy keeps TACOS (total advertising cost of sales) below 15%
- Fully managed Amazon account lets our clients focus on product development and logistics — the rest is taken care of by NOODL
- Made packaging adjustments to save $5 on each FBA shipment. This added about $7,500 to their bottom line each month
Custom Dashboard Structure
If you’ve ever tried to get meaningful reports from Amazon Seller Central, you know how frustrating it can be to put together all the data.
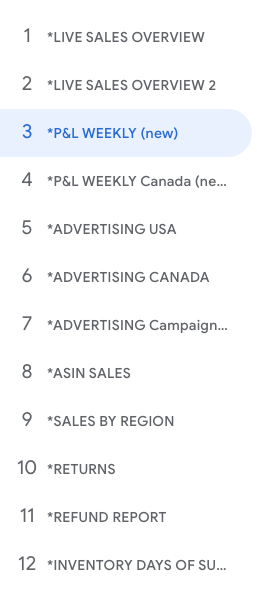
Endless manual downloads of specific reports, all in different formats, and a dizzying array of pivot tables took its toll. We opted to build custom dashboards using a direct API connection to Amazon’s data. This allowed us to have real-time reporting (2hr delay) for critical metrics and reports that included:
- Profit & Loss statement that took into account cost of goods, ad spend, returns and Amazon selling fees. This report is broken down by product so we can see exactly what’s going on. We take into account, Amazon Fees, Refunds, Ad Spend and Cost of Goods
- Live sales data by product group showing sales for yesterday, last 7 days, last 14 days, last 30 days and last 90 days.
- Rolling 16 week sales trend
- Rolling 13 month sales history
- Returns report by product showing return rate and return reason
- Inventory restocking report showing days of supply based on sales trend and current inventory levels
Custom metrics we track:
- Order Acquisition Cost (OAC) – advertising cost divided by total units sold
- Revenue Per Click (RPC) – the amount of revenue generated from ads each click – ad revenue divided by total PPC clicks
- Profit Multiple on Ad Spend (PMOAS) – net profit divided by ad spend – shows us the true return on ad spend. Net profit is calculated as revenue minus (COGS + Amazon fees + Ad Spend + Refunds).
- Total Advertising Cost of Sales (TACOS) – ad spend divided by total revenue
- Best Seller Rank Trend – shows relative performance to the marketplace. We track both the broad category trend as well as the most relevant subcategory rank for each product.
- Multi market aggregation to see total sales and profits
*NOTE: to maintain client privacy, we do not publish our client’s names on our website.